Track Record
Investing is about running a Marathon, not a 100m Sprint.
My aim is not to beat the benchmark, but to generate high long-term returns. Beating the benchmark over a long period of time should only come as a consequence of that.
Volatility is not a concern for me, thus temporarily achieving a lower or a higher performance than the index should not be viewed as relevant.
Comment
Following the company inception, I could start doing the first investments at the beginning of August 2018. For the sake of simplicity, the starting date for the calculation of the portfolio performance will be August 1st, 2018, i.e. Value as of August 1st = 100,-.
I intend to post the portfolio performance on a quarterly basis, i.e. March 31st, June 30th, September 30th, and December 31st.
Performance: Price vs. Value
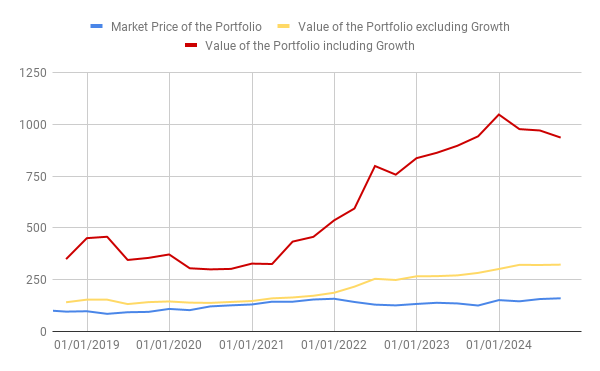
The graph below represents the price of the portfolio vs. the intrinsic value of the business, both excluding and including growth potential. The intrinsic value excluding growth represents what the company should be worth in a steady-state situation, i.e. if it is not growing. This is a fairly conservative value and especially help in calibrating down-side risk to the portfolio. The intrinsic value with growth represents what the company is worth if they keep on growing and re-investing into their business. This is more a measure of the upside potential of the company. Remember that the intrinsic value calculation is just my own assumption about what a business is worth.

Performance: Price vs. Stoxx Europe 600 (net)
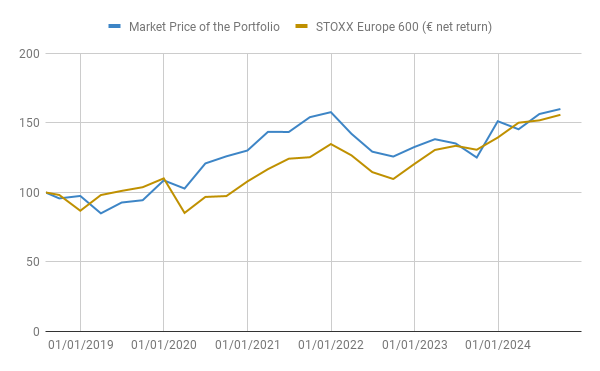
The graph below is a benchmarking of the portfolio performance vs. a benchmark which I have selected as the Stoxx Europe 600 (net return, i.e. included the dividends paid, net of withholding fees). The STOXX Europe 600 Index represents large, mid and small capitalization companies across 17 countries of the European region. This matches quite well with my hunting ground.

